Steven Ruggles, a historical demographer at the University of Minnesota who has built a career deciphering census says his team is currently working on linking people who were children in 1940 to lead in the water to Medicare records, in an effort to see if there is an association between the lead levels and early onset Alzheimer’s disease.
I’m sure using data like these to study Covid-19 will be a major source of doctoral dissertations for many decades to come. Eventually, that will become historical demography, too.
What kinds of things do you study?
Right now, I’m working on a paper on race differentials in marriage since 1960. I developed a new way to measure age-specific rates of first marriage that can offer scholars a new look at the “male marriageability” hypothesis — the notion that the reason fewer Black couples marry is that there is a shortage of marriageable Black men.
The data show that in the 20th century, economic circumstances explain the difference in marriage rates. The gap is diminishing in the 21st century, and I think that’s a result of the declining importance of male work. Now the relative importance of other factors, like women’s income, is a much bigger factor.
You have studied women’s work throughout your career.
Yep. I argue that the rise of women’s employment is one of the key transformational events for family structure. In the 19th century, we had the corporate family, in which work was done on farms or other family enterprises, with or without slaves. The whole family was involved, and authority was vested in the senior male.
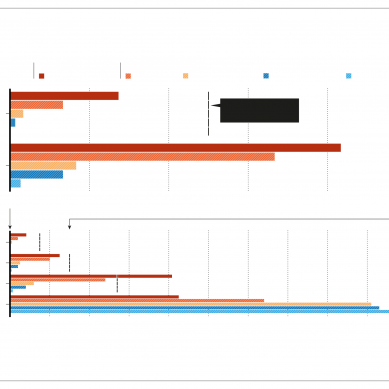
US census data and other records reveal dramatic shifts in family economies. The “corporate family,” for example – large familial units organized around a single business or farm – dominated for nearly a century, before giving way to households led by individual male wage-earners, and then dual-income couples and solo female breadwinners.
The first challenge to this order was the rise of reasonably paid male employment. With other opportunities, sons weren’t forced to stick around and multigenerational families quickly eroded. Then male breadwinner families predominated, from 1930 to 1970. By 1980, female- or dual-income families surpassed 50 per cent of married-couple households. Female breadwinner families are now a significant category.
You mentioned that people married late in the 16th and 17th centuries. I would have assumed that people always married young before the 20th century. Romeo and Juliet is one reason why people think that. Except that Shakespeare wasn’t writing about his own period in history, when marriage age was at its highest. He was writing about an exotic, old Italian place where he imagined that people married very young.
The truth was, they didn’t. In the European family system, you had to have some land, and a way to support your family, before you could get married, so it tended to be fairly late. At the end of the 17th century, the median marriage age in England was 27 for women, and maybe 29 or 30 for men.
What’s the median age of marriage today?
Historically you can measure actual marriage age, but you can’t do it for the present. We don’t know how late people today are going to marry because they aren’t done marrying yet. We will know only after everybody is dead and gone.
As an estimate, though, among white women the median right now is around 29 years. For men it’s just a year or two older. It’s later than ever before, certainly in American history, and it’s probably later than it was in north-western Europe in the 1600s.
You also can project what portion of people are never going to get married. It may approach 40 percent by the time today’s 20- to 24-year-olds reach 45 to 54 years of age. The age at which people marry has fluctuated over the centuries. In the US, census data show that marriage age for men and women hit a low in the 1960s and then shot up, reaching a new high today.
Is that a striking shift?
There are a lot of demographers who say people are just delaying marriage. But that’s never happened before, except in one cohort: the people who came of age during World War II. In all the other cohorts of the 20th century, the percentage of women married at 20 to 24 is an extremely good predictor of the proportion that ever get married.
Then again, I’m not really responsible for predicting the future because I’m a historian! So, I could be wrong.
Obviously, these trends tell us something about history, and where we came from. Are there also policy implications?
The impact of economic factors on families has huge policy implications. Demography also has enormous potential to improve our understanding of health. Demographers have been furiously studying the impacts of the Covid-19 pandemic on various slices of the population, research that could help guide public health.
In recent years, partly because we have all these new data, there’s been a huge amount of research on the 1918 pandemic – its impact, and its long-running echo. People look at babies conceived during that pandemic and see what happened to them compared to people conceived right before and right after, and trace those outcomes over time. I imagine there will be far-reaching consequences for the Covid-19 pandemic as well.
Is the research into the 1918 pandemic ongoing?
It’s been a real boom, fuelled by the new data. Most of the demographers studying the 1918 influenza at our population centre are looking at its impacts on work and family and poverty. Studying records linked to individuals who were very young in 1918 – including people in utero at the time – show that they carried scars for the rest of their lives: poor health consequences, lower educational attainment and less economic success. Another really cool health study linked the 1930 census to selective service records from World War II.
The researchers here looked at people who were infants or very small children in 1930 and determined the acidity of the water supply in the neighbourhoods where they grew up. This correlates with the amount of lead in their drinking water. When they also looked at the selective service records for each individual, which included IQ tests, they found that 20 percent of the variation in intelligence tests in 1945 could be linked to lead levels in the water supply from when they were children.
- A Knowable Magazine report
